A Comment on Kevin Drum’s “Technical Preface”...
…to his review of my “Slouching Towards Review"
I think that Kevin Drum here, in a preface to his review of my Slouching Towares Utopia <bit.ly/3pP3Krk>, though thoughtful, is wrong:
Kevin Drum: Slouching Towards Utopia: A technical preface to an actual review: ‘Between about 1666 and 1900, growth was higher than the orange [constant-growth exponential] curve. And even within that period, there are two sub-periods that stand out: 1666-1720 and 1820-1870…. Here's how I interpret this: Nothing unique happened in 1870. Great Britain was just following its normal growth path…. In the 17th century this produced GDP high enough to support a growing urban craft class but did little for ordinary workers. By the late 19th century GDP finally reached a point where (a) workers started demanding a bigger share of the pie and (b) capitalists were rich enough that they could afford to meet workers' demands without any real hardship. In any exponential growth curve there's always a knee in the curve where it suddenly seems like things have changed…
Let me raise three points:
1/ His claim “nothing unique happened in 1870” is wrong, for as he says later on “in any exponential growth curve there’s always a knee in the curve”.
Whether there was something unique happening in 1870 with respect to the causes and course of growth is something we can and will argue about.
But there is no doubt that there was something unique happening in 1870 with respect to the consequences of growth. Before 1870 there was no chance that humanity could bake a sufficiently large economic pie for everyone to potentially have enough, with all the downstream effects that impossibility entails. After 1870 the day of baking a sufficiently large economic pie was visible and rapidly coming closer, with all the opportunities that possibility entails. And that is what my book is about—consequences much more than causes.
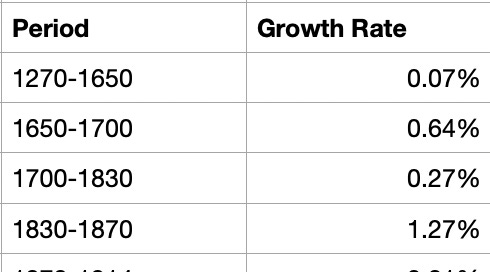
2/ Kevin’s claim that British economic growth since 1450 is well-enough modeled by a constant exponential growth curve with an average annual growth rate of 1.8%/year does not seem to me to be right either. I look at the same numbers for real income per capita in Britain that Kevin looks at, and I see:
Estimated British Real Income Growth
There is nothing going on in terms of income growth before 1650. Then there is a surge in the second half of the 1600s—one that comes too early to attribute to the effects of the Glorious Revolution of 1688, and that I attribute to the agricultural and the imperial-commercial revolutions. But that is an unsustainable “efflorescence”, rather than a shift to a new growth régime. In Britain, the permanent upward shift in the growth rate comes around 1830, with deviations thereafter as Britain loses its paramount industrial supremacy over 1870-1914, with the Age of Chaos from 1914-1950, and then recovery of lost ground from 1950-1980.
So why not start my “Long 20th Century” in 1830? One consideration is that the jump-up in British real wages is much closer to 1870 than 1830. But the big reason is that Britain is only a small part of what I am looking at. The big reason is that Britain was the leading technological edge of the integrated economy of the Dover Circle—plus their settler colonies—for a relatively short time, from roughly 1700-1870. It is the Dover Circle economy that I think matters. And it is the world that matters more.
3/ Most important, however: the growth acceleration for the bulk of the world economy—rather than just the small technological leader of it takes place around 1870.


I believe that Drum has fooled himself about the goodness of fit of his graph by choosing to display raw values in the Y-axis instead of log values. This makes the early part of the fit look excellent because the absolute differences are tiny. But those are not the differences that matter, for fitting an exponential; it is the difference in logs. A good metric of fit would make a misfit in the early part of the curve just as consequential as one at the end.