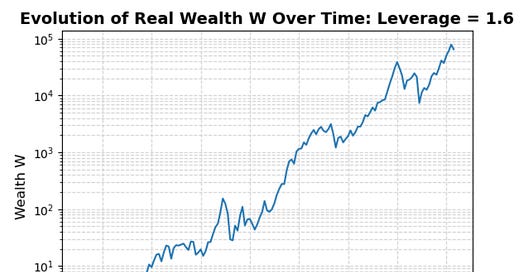
NOTE TO SELF: Optimal Ex-Post Stock-Market Leverage
RA Yekwang Hwang reports with some updated numbers: don't you dare borrow more þan 60% of your wealth & invest þe whole thing in þe stock market!
Suppose you:
start in January 1871 with an initial wealth W,
choose a leverage L,
invest W*L in the stock market,
invest W*(1-L) in safe long-term Treasury bonds,
reinvest interest and dividends,
pay no taxes,
incur no transactions costs,
and rebalance every January.
Then, for Robert Shiller’s version of the long-run “market”, i.e., the Cowles Commission’s data series spliced in the mid-1920s to the S&P Composite…
Optimal ex-post leverage is 1.6: that gets you a real continuously-compounded average geometric return from 1871 to 2023 of 7.291%/year, and a cumulative wealth-amplification factor across the century-and-a-half of 65004. (Compare to the zero-leverage all-bond portfolio annual real return of 2.448%/year and wealth-amplification factor of 41.)
Note that there is significant asymmetry here:
Dropping your leverage to 1 sacrifices only 0.569%-points of annual return: you have an average ex-post return of 6.722%/year and a cumulative wealth-amplification factor of 19360.
By contrast, raising your leverage to 2.2 sacrifices 1.8884%-points of annual return: it drops your average ex-post return to 5.407%/year and a cumulative wealth-amplification factor of 3708.
Indeed, if you choose a leverage factor of 2.3 you go spectacularly bankrupt in 2009.
And if you choose a leverage factor of 2.4 you go spectacularly bankrupt in 1931 and again (if you are allowed to restart your portfolio) in 2009.
Ole Peters and Alexander Adamou have a “Leverage Efficiency” argument that the optimal leverage cannot be greater than 1 (or, rather, greater than the share of equity’s claims in all wealth). If it were greater than 1 (or, actually, the much smaller number that is equity’s claims share) than people who followed such optimal-leverage strategies would outperform, and so acquire a greater and greater share of the society’s total wealth. Hence the market’s average leverage ratio will rise, but the market’s average ratio cannot rise because it is what it is. Hence just as market efficiency pushes prices to their fundamental rational values, leverage efficiency pushes the optimal Kelly-criterion leverage to 1 (or lower).
Ha! E pur si muove.
You can argue that 1.6 has to be an overestimate, because somewhere lurking out there in the distribution there is a worse annual return than the -60% return of 2008-2009, and in the longest run the optimal-leverage portfolio cannot be one that runs any risk at all of relative bankruptcy vis-à-vis long Treasury bonds. Thus the optimal leverage in the long-run be less than minus one divided by the worst conceivable (relative to long Treasury bonds) return.
I take your point.
But I do not find it powerful in bearing on any of the real-world questions of portfolio strategy we might want answers to. For that, I think the ex-post optimal leverage over the sample might well provide a better guide.
More ground can be gained, I think by noting that the aggregate stock market is so volatile that even the 4.883%-points/year equity-return premium vis-à-vis long Treasury bonds (the difference between the 7.291%/year L=1 and the 2.448%/year L=0 portfolio) is not worth anyone’s exploiting beyond L=1.6.
A 4.883%-points/year equity-return premium is a powerful mispricing. Take a real cash flow growing at the 1.7%/year average rate of American per capita consumption since 1870, and it is valued at 125 times this year’s coupon if it is labeled “Treasury bond” and at only 18 times this year’s dividend if it is labeled “stock index”. There is no way that is consistent with any sense of declining marginal utility-driven risk aversion and the risk-bearing capacity of America, as Mehra and Prescott formalized long ago.
But note that there are all the extraordinary swings in stock-market valuation ratios relative to any estimate of “permanent earnings”. Note how these valuation-ratio swings are what drive the optimal-leverage Kelly-criterion bet down to 1.6 times portfolio wealth. See that it is not (much) in any institution’s interest to try to make (much) money off of this staggering mispricing.
Yes, almost all of the valuation-ratio shifts will be reversed in the medium-long run.
But patient capital is very rare, and how much you can leverage up is steeply constrained by the fact that you have to survive until the medium-long run actually comes.
Thus I once again return to something I have long known: Yes, stocks for the long run. But the smartest thing ever written in this literature is Andrei Shleifer and Robert W. Vishny (1997): The Limits of Arbitrage…


"start in January 1871 with an initial wealth W,
choose a leverage L,
invest W*L in the stock market,
invest W*(1-L) in safe long-term Treasury bonds,
reinvest interest and dividends,
pay no taxes,
incur no transactions costs,
and rebalance every January.
"
How does the average person have leverage of > 1 as this means shorting LT treasuries? How can you avoid transaction costs AND rebalance [what exactly] annually.
This all seems as nonsensical as technical trading on prices ASSUMING NO TRANSACTION COSTS.
L=1 means 100% equities. Where is the 1987 stock market drop? Not visible. How can that be?
The analysis should assume any starting point and evaluate the 10 year returns. How many years do you get real value losses? [Wasn't this the case 1970-1980 - that is visible in teh charts?]
Math typo? What does W*(1-L) mean when L>1, as is the case for optimal L = 1.6?