


What Is the Ten-Year Real Rate Going to Be? I: How We Got Here
What Is the Ten-Year Real Rate Going to Be? I: How We Got Here
What are the odds that bond rates are going to return to the 2010s normal? Low. But some mean-reversion is highly likely. How much? My guess is 0.5%-points, plus whatever in the recent interest...

What are the odds that bond rates are going to return to the 2010s normal? Low. But some mean-reversion is highly likely. How much? My guess is 0.5%-points, plus whatever in the recent interest-rate rise is an overreaction to shifts in the fundamental flow-of-funds supply-demand balance—but I run out of space here before I can even start analyzing that…
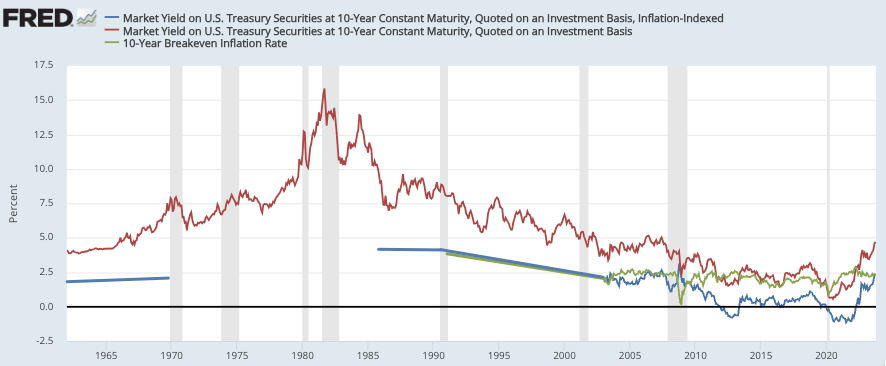
Since the early 2000s, after Larry Summers’s strong push that the U.S. Treasury should issue an inflation-indexed bond led to the creation of the TIPS—the Treasury Inflation-Protected Security—we have had a market gauge of not just the nominal safe long-duration price of money—the Ten-Year U.S. Treasury interest rate—but of its division into the real rate (the blue line) and the expected inflation rate (the green line). Back earlier we do not have such a market gauge. Thus figuring out what of the 10-Year Treasury rate is the real safe long-duration slope of the intertemporal price system and what is expected inflation is up for grabs. All we have before 2003 is the nominal 10-Year Treasury rate:
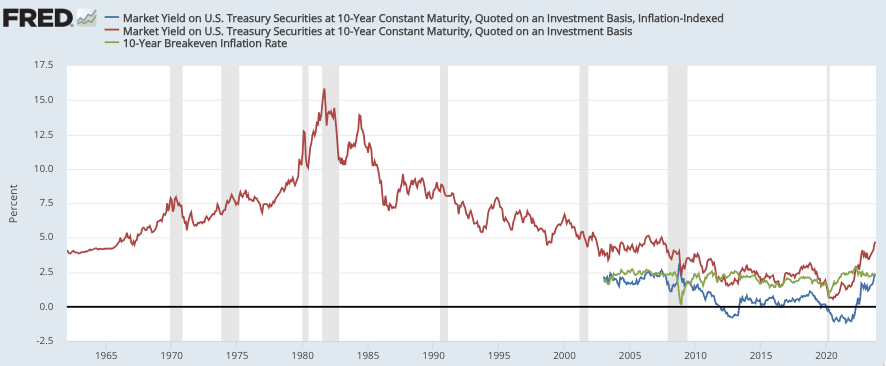
My guess is that in the 1960s the real rate was between 2 and 2.5%. Things are very confused between the start of the 1970s and the mid-1980s—the inflation of the 1970s made all calculations of what the real rate might have been grossly uncertain. My guess is that by 1986 the real rate had settled at 4%, and that from the start of the 1990s to 2003 it declined from 4% to the value of 2.3% at which we pick up the TIPS market gauge in 2003. And thereafter we have the collapse to the essentially zero of the secular-stagnation 2010s and then the -1% of the COVID plague years:
Keep reading with a 7-day free trial
Subscribe to Brad DeLong's Grasping Reality to keep reading this post and get 7 days of free access to the full post archives.